Machine Learning offers many powerful algorithms for solving classification and regression problems. Among them, the Support Vector Machine (SVM) stands out for its ability to create highly accurate decision boundaries, especially when working with complex datasets.
SVM is widely used in applications such as spam detection, image recognition, medical diagnosis, and cybersecurity because it performs well even when datasets have many features. In this beginner-friendly guide, you’ll learn what Support Vector Machine is, how it works, important SVM concepts, the role of kernels, and its real-world applications. These concepts are covered in the AI learning material.
What is a Support Vector Machine (SVM)?
A Support Vector Machine (SVM) is a Supervised Machine Learning algorithm primarily used for classification, although it can also be applied to regression problems.
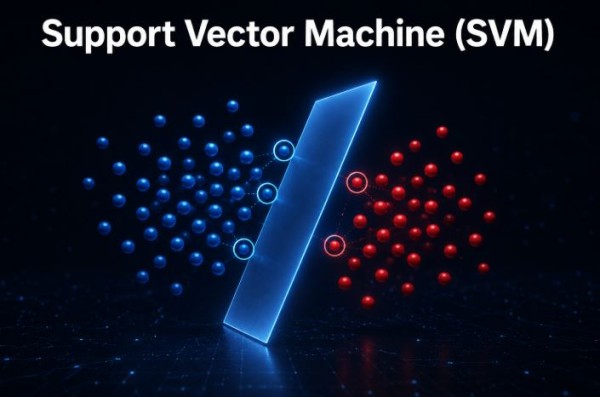
The main objective of SVM is to find the best possible decision boundary that separates different classes of data with the maximum possible margin.
Unlike many algorithms that simply classify data, SVM focuses on finding the boundary that provides the best separation between classes, making it highly effective for many real-world problems.
Why is it Called Support Vector Machine?
The name Support Vector Machine comes from three important concepts.
Support
The data points closest to the decision boundary are called Support Vectors.
These points play the most important role in determining where the decision boundary should be placed.
Vector
Each data point is represented mathematically as a vector containing feature values.
Machine
It is a Machine Learning algorithm that learns patterns from data and makes predictions.
These three ideas together give the algorithm its name.
Important Terms in SVM
Before learning how SVM works, it’s helpful to understand a few key concepts.
1. Features
A feature is an input variable used by the model to make predictions.
Examples:
- Age
- Salary
- Height
- Temperature
- Income
The presentation defines a feature as an input variable used to make predictions.
2. Label
A label is the output that the model tries to predict.
Examples:
- Spam / Not Spam
- Cat / Dog
- Yes / No
- Fraud / Genuine
The presentation describes the label as the output the model predicts.
3. Data Point
A data point represents one row or one observation in the dataset.
Each data point contains multiple feature values along with its corresponding label.
4. Feature Space
The feature space is the space created by all input features.
Examples:
- 2 Features → Two-dimensional (2D) space
- 3 Features → Three-dimensional (3D) space
As the number of features increases, the feature space becomes higher dimensional.
5. Decision Boundary
The decision boundary is the line or surface that separates different classes.
For example:
- Left side → Class A
- Right side → Class B
Every new data point is classified based on which side of the boundary it falls.
6. Hyperplane
A hyperplane is the mathematical decision boundary that separates different classes.
In:
- Two dimensions → The hyperplane is a line.
- Three dimensions → The hyperplane is a plane.
- Higher dimensions → It becomes a hyperplane.
The presentation defines the hyperplane as the decision boundary that separates classes.
7. Margin
The margin is the distance between the decision boundary and the nearest data points.
A larger margin generally results in better generalization and improved model performance.
8. Support Vectors
Support Vectors are the training examples closest to the decision boundary.
These points determine the position of the hyperplane and have the greatest influence on the model.
Linear Separation
Sometimes, data can be separated perfectly using a straight line.
This situation is called Linear Separation.
If a straight line can completely divide the classes, SVM uses a linear hyperplane.
Nonlinear Separation
Real-world datasets are often more complicated.
Sometimes, a straight line cannot separate the classes effectively.
In such situations, SVM uses Kernel Functions to create nonlinear decision boundaries that better separate the data.
What is a Kernel?
A Kernel is a mathematical function that allows SVM to solve nonlinear classification problems.
Instead of explicitly transforming data into a higher-dimensional space, the kernel computes similarities as if the transformation had already occurred.
This enables SVM to classify complex datasets efficiently without directly performing expensive computations.
Common Kernel Types
Some commonly used kernel functions include:
- Linear Kernel
- Polynomial Kernel
- Radial Basis Function (RBF) Kernel
- Sigmoid Kernel
Each kernel is suitable for different types of datasets and classification tasks.
How Does SVM Work?
The basic workflow of SVM is straightforward:
- Receive labeled training data.
- Represent each observation as a vector.
- Find the hyperplane that best separates the classes.
- Maximize the margin between the hyperplane and the nearest data points.
- Use support vectors to define the final decision boundary.
- Classify new data based on which side of the boundary it falls.
Advantages of Support Vector Machine
According to the presentation, SVM offers several benefits.
It:
- Works well with high-dimensional data.
- Remains effective even when there are many features.
- Can model nonlinear relationships using kernel functions.
- Often performs well on small-to-medium-sized datasets.
Disadvantages of Support Vector Machine
Although SVM is a powerful algorithm, it also has some limitations.
The presentation lists the following disadvantages:
- Training can be slow on very large datasets.
- Sensitive to feature scaling.
- Less interpretable than simple models such as Decision Trees.
Real-World Applications of SVM
Support Vector Machines are widely used in many industries.
Some common applications include:
- Email Spam Detection
- Face Recognition
- Handwriting Recognition
- Image Classification
- Medical Diagnosis
These examples are highlighted in the presentation.
Additional practical applications include:
- Cybersecurity threat detection
- Malware classification
- Intrusion detection systems
- Credit risk assessment
- Customer sentiment analysis
Best Practices for Using SVM
To achieve better performance with SVM:
- Scale or normalize numerical features before training.
- Choose an appropriate kernel based on the dataset.
- Tune hyperparameters such as C and gamma using cross-validation.
- Remove unnecessary or irrelevant features.
- Evaluate performance using Accuracy, Precision, Recall, and F1 Score.
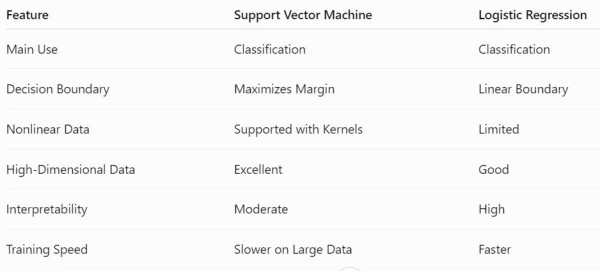
Support Vector Machine vs Logistic Regression