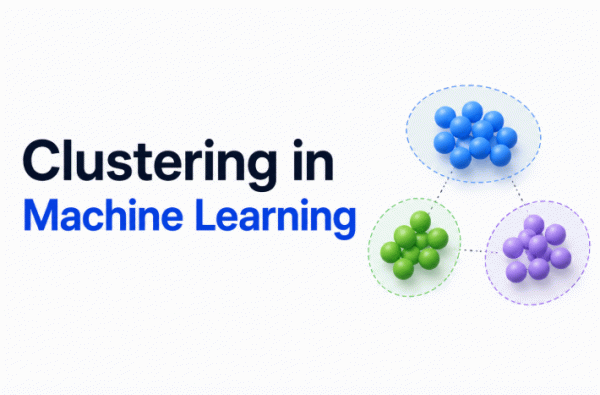
Machine Learning is broadly divided into Supervised Learning and Unsupervised Learning. While supervised learning works with labeled data, unsupervised learning focuses on discovering hidden patterns and relationships without predefined outputs.
One of the most popular unsupervised learning techniques is Clustering, which groups similar data points together. Among the various clustering algorithms, K-Means Clustering is the most widely used due to its simplicity, speed, and effectiveness.
In this beginner-friendly guide, you’ll learn what clustering is, how K-Means works, important concepts like clusters and centroids, its advantages, disadvantages, and real-world applications. These concepts are covered in the AI learning material.
What is Unsupervised Learning?
Unsupervised Learning is a type of Machine Learning where the algorithm learns patterns from unlabeled data.
Unlike supervised learning, there is no target or output column. Instead, the algorithm identifies hidden structures and relationships within the data.
The main goal of unsupervised learning is to discover:
- Hidden patterns
- Similar groups
- Relationships
- Structures in data
What is Clustering?
Clustering is the process of dividing data into groups, known as clusters, where data points within the same group are more similar to each other than to those in other groups.
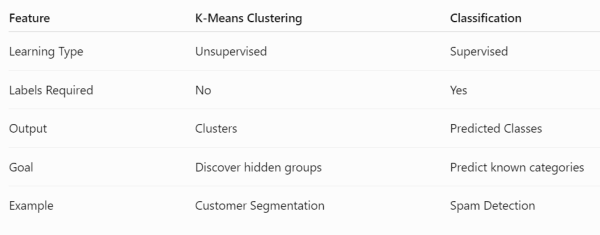
Unlike classification, clustering does not rely on predefined labels. Instead, it automatically identifies natural groupings based on similarities in the dataset.
Why is Clustering Important?
Clustering helps organizations better understand their data by grouping similar records together.
It is commonly used for:
- Customer segmentation
- Market research
- Recommendation systems
- Fraud detection
- Image segmentation
- Document organization
- Social network analysis
How Does Clustering Work?
Clustering follows a straightforward process:
- Take the dataset.
- Measure the similarity between data points, usually using distance.
- Group nearby points together.
- Form clusters.
The objective is to ensure that points within the same cluster are as similar as possible, while points in different clusters remain distinct.
What is K-Means Clustering?
K-Means is one of the most popular Unsupervised Learning algorithms.
It divides data into K clusters, where each data point belongs to the cluster with the nearest center, known as the centroid.
K-Means is widely used because it is easy to implement and performs efficiently on many practical datasets.
Why is it Called K-Means?
The name K-Means comes from two important concepts.
K
“K” represents the number of clusters you want to create before training the algorithm.
For example:
- K = 2 → Two clusters
- K = 3 → Three clusters
- K = 5 → Five clusters
Means
“Means” refers to the average value of all the data points in a cluster.
This average becomes the centroid, which represents the center of the cluster.
What is a Cluster?
A cluster is simply a group of similar data points.
For example, an e-commerce company may group customers based on purchasing behavior, resulting in clusters such as:
- Budget shoppers
- Regular customers
- Premium customers
Each cluster contains customers with similar characteristics.
What is a Centroid?
A centroid is the center point of a cluster.
It is calculated by taking the average (mean) of all data points within that cluster.
As the algorithm runs, centroids are continuously updated until they reach stable positions.
How Does K-Means Work?
K-Means follows five main steps to create clusters.
Step 1: Select the Value of K
The first step is choosing the number of clusters (K) you want the algorithm to create.
Example:
K = 3
This means the dataset will be divided into three clusters.
Step 2: Choose Initial Centroids
The algorithm randomly selects K initial centroids.
These centroids serve as the starting points for the clustering process.
Step 3: Calculate Distance
Next, the algorithm calculates the distance between every data point and each centroid.
Each point is assigned to the cluster whose centroid is closest.
The presentation demonstrates this process using a customer income example, where customers are grouped based on similar annual income values.
Step 4: Compute New Centroids
Once all points are assigned to clusters, the algorithm calculates the average value of each cluster to create new centroids.
These updated centroids better represent the center of their respective clusters.
Step 5: Repeat the Process
The algorithm repeats the assignment and centroid calculation steps until the centroids no longer change significantly or a stopping condition is reached.
At this point, the final clusters are formed.
Real-World Example of K-Means
Imagine you own a shopping mall and have information about customers’ annual incomes.
Instead of manually grouping customers, K-Means automatically identifies groups with similar income levels. These clusters can then be used for:
- Personalized marketing
- Loyalty programs
- Product recommendations
- Customer segmentation
The presentation illustrates this concept using customer income data.
Advantages of K-Means Clustering
According to the presentation, K-Means offers several benefits:
- Simple to understand and implement
- Fast on small to medium-sized datasets
- Scales well to large datasets
- Easy to interpret
Disadvantages of K-Means Clustering
Although K-Means is widely used, it has some limitations.
The presentation lists the following disadvantages:
- You must choose the value of K before training.
- Sensitive to the initial centroid positions.
- Sensitive to outliers.
- Does not perform well on clusters with irregular shapes.
Common Applications of K-Means
K-Means is used across many industries, including:
- Customer Segmentation
- Recommendation Systems
- Market Basket Analysis
- Image Compression
- Image Segmentation
- Fraud Detection
- Medical Data Analysis
- Document Clustering
- Social Network Analysis
- Sales and Marketing Analytics
Best Practices for Using K-Means
To improve clustering performance:
- Normalize numerical features before training.
- Choose the appropriate value of K using techniques like the Elbow Method.
- Remove outliers where possible.
- Use meaningful features that capture important patterns.
- Evaluate cluster quality using metrics such as the Silhouette Score.
K-Means vs Classification
Stay Tuned For The Next Blog . ✌