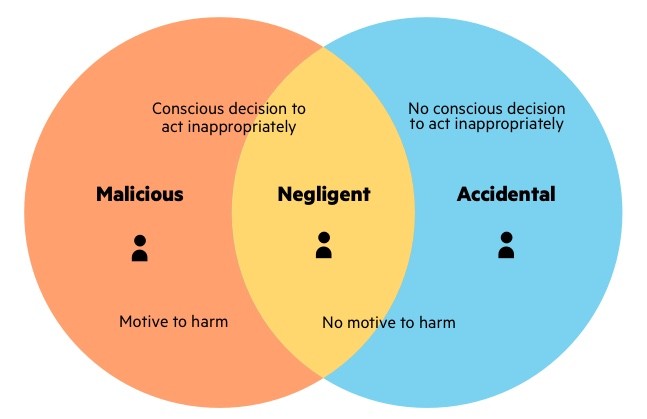
Insider Threat- “An insider threat is a security risk that originates from within the targeted organization. It typically involves a current or former employee or business associate who has access to sensitive information or privileged accounts within the network of an organization, and who misuses this access.” Imperva

Malicious Insider Threat Indicators
Anomalous activity at the network level could indicate an inside threat. Likewise, if an employee appears to be dissatisfied or holds a grudge, or if an employee starts to take on more tasks with excessive enthusiasm, this could be an indication of foul play. Trackable insider threat indicators include:
Activity at unusual times—signing in to the network at 3 am
The volume of traffic—transferring too much data via the network
The type of activity—accessing unusual resources
For Our Use case we use these factors:
- logins per day/week
- Time of day of logins
- Most accessed resources
- Frequency of data transfers
- Command execution patterns
- User role or department
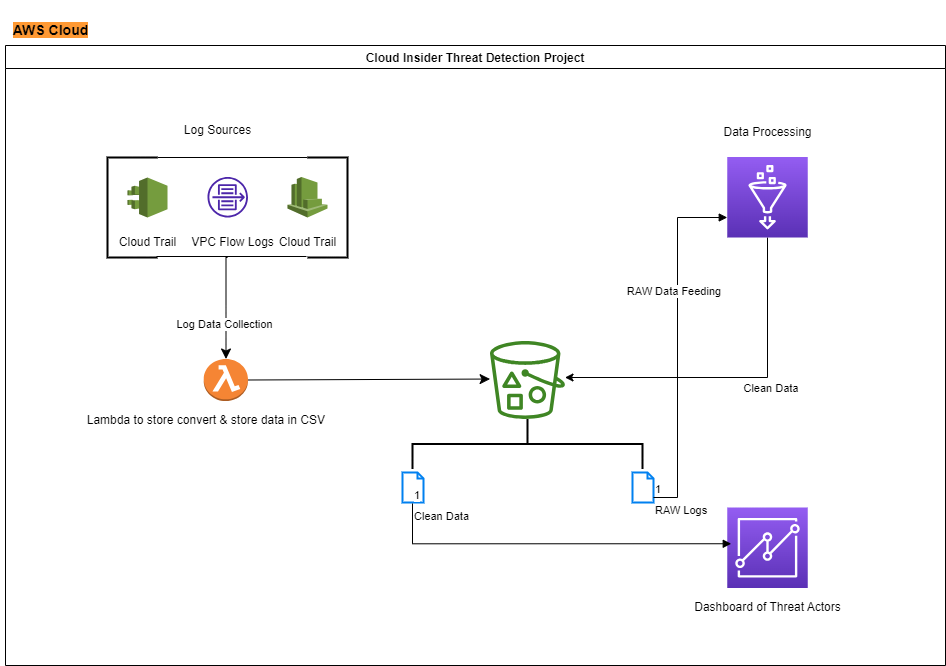
Architecture:

Lambda Code:
import pandas as pd
from sklearn.cluster import KMeans
from sklearn.ensemble import IsolationForest
from sklearn.preprocessing import StandardScaler
# Load the user activity logs into a DataFrame[upl-image-preview url=https://hacklido.com/assets/files/2023-09-02/1693692846-29482-aws.png]
data = pd.read_csv('user_activity_logs.csv')
# Feature Engineering
# Example features: number of logins per day, average login time, etc.
features = data[['user_id', 'feature1', 'feature2', ...]]
# Data Preprocessing
scaler = StandardScaler()
scaled_features = scaler.fit_transform(features)
# Behavior Profiling (Clustering)
num_clusters = 5
kmeans = KMeans(n_clusters=num_clusters, random_state=42)
data['cluster'] = kmeans.fit_predict(scaled_features)
# Anomaly Detection (Isolation Forest)
anomaly_detector = IsolationForest(contamination=0.05, random_state=42)
data['anomaly_score'] = anomaly_detector.fit_predict(scaled_features)
# User Risk Scoring
data['risk_score'] = data['anomaly_score'] * data['cluster'] # Combine anomaly score and cluster
# Alert Generation
threshold = 0.5 # Define a threshold for risk score
alerts = data[data['risk_score'] > threshold]
# Visualization (using libraries like matplotlib or seaborn)
# Create visualizations to display user behavior patterns, anomalies, risk scores, and alerts
# Model Evaluation
# Use historical data with known anomalies to evaluate the performance of the model
# Feedback Loop
# Gather feedback from security analysts to refine the model and thresholds
# Ethical Considerations
# Ensure data privacy and follow ethical guidelines throughout the process