If you want to pursue your career as an SOC analyst, you can get hand- off experience for free by setting up your own SIEM labs. Here’s how I did it.
What is a SIEM lab?
A SIEM lab is a controlled environment where one can practice using SIEM tools to perform MDIR : Monitor, Detect, Investigate and Respond to security events. They are set up to give you a taste of real-world cyber security scenarios, and let learners know how SIEM systems work in protecting networks, applications, and systems in real settings.
Platforms to build home SIEM labs
ELK Stack, Security Onion, Wazuh, AlienVault OSSIM , Elastic are some free tools to help you get started with your first lab deployment. I used Elastic for my first setup.
Prerequisites(for linux): Elastic account(available for free)
Task 1: Set up your elastic account:
- Sign up for a free trial to use Elastic Cloud at https://cloud.elastic.co/registration
- log in to the Elastic Cloud console at https://cloud.elastic.co.
- “Start your free trial.”——> “Create Deployment” ——> “Elasticsearch” as the deployment type——> “Create Deployment.”
- Once the deployment is ready, click “continue.”
Task 2: Setting up the Agent to Collect Logs
What is an agent?
In the context of Elastic SIEM, an agent is used to collect and forward security-related events from your system to your Elastic SIEM instance.
- Login to your Elastic account, click on the 3 lines icon at the top left, then select “Integrations” at the bottom.
- Select Elastic Defend from the search menu.
- Click on “Install Elastic Defend” , and finish up the installation procedure.
- Paste the given command in “Linux Tar” in your Linux Terminal.
- Once the agent is installed, It will automatically start collecting and forwarding logs to your Elastic SIEM instance,it might take a few minutes for the logs to appear in the SIEM.
Task 3: Create Security Events
Run a few basic scans in your linux terminal using Nmap that’ll create new security events and send the logs to the SIEM.
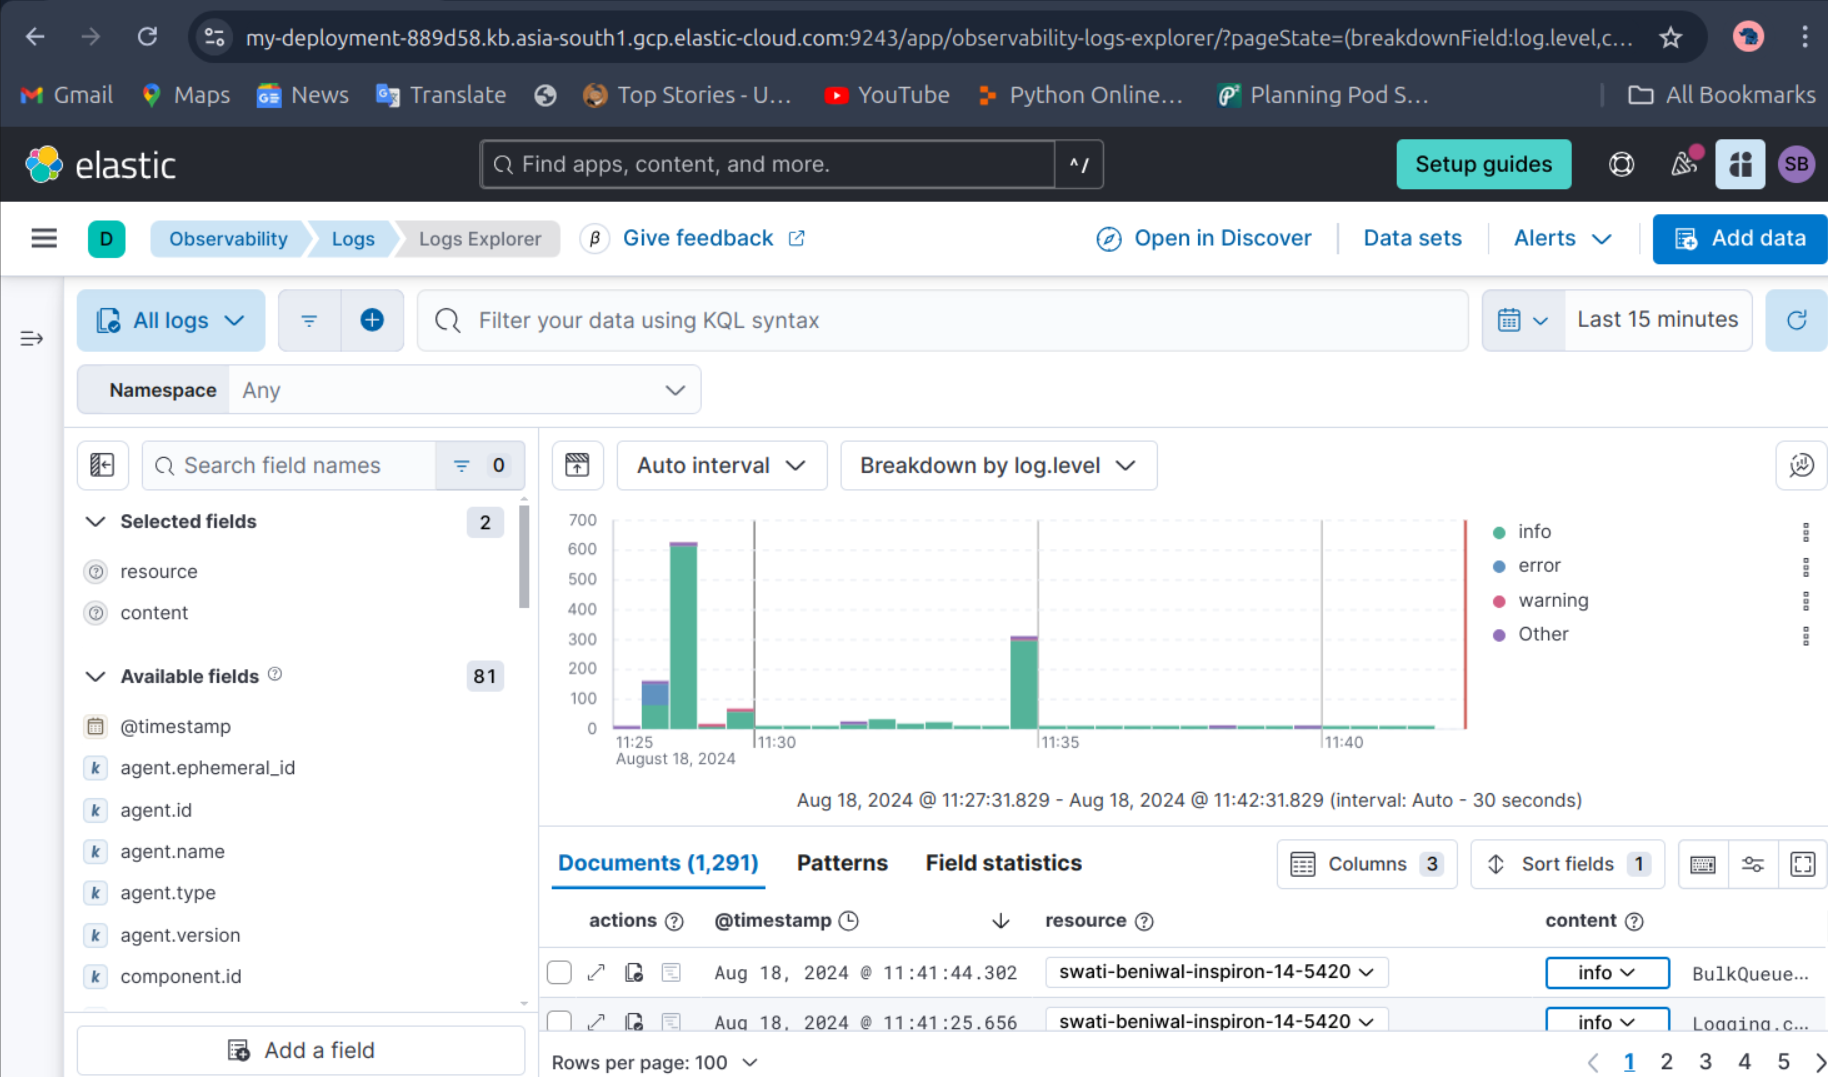
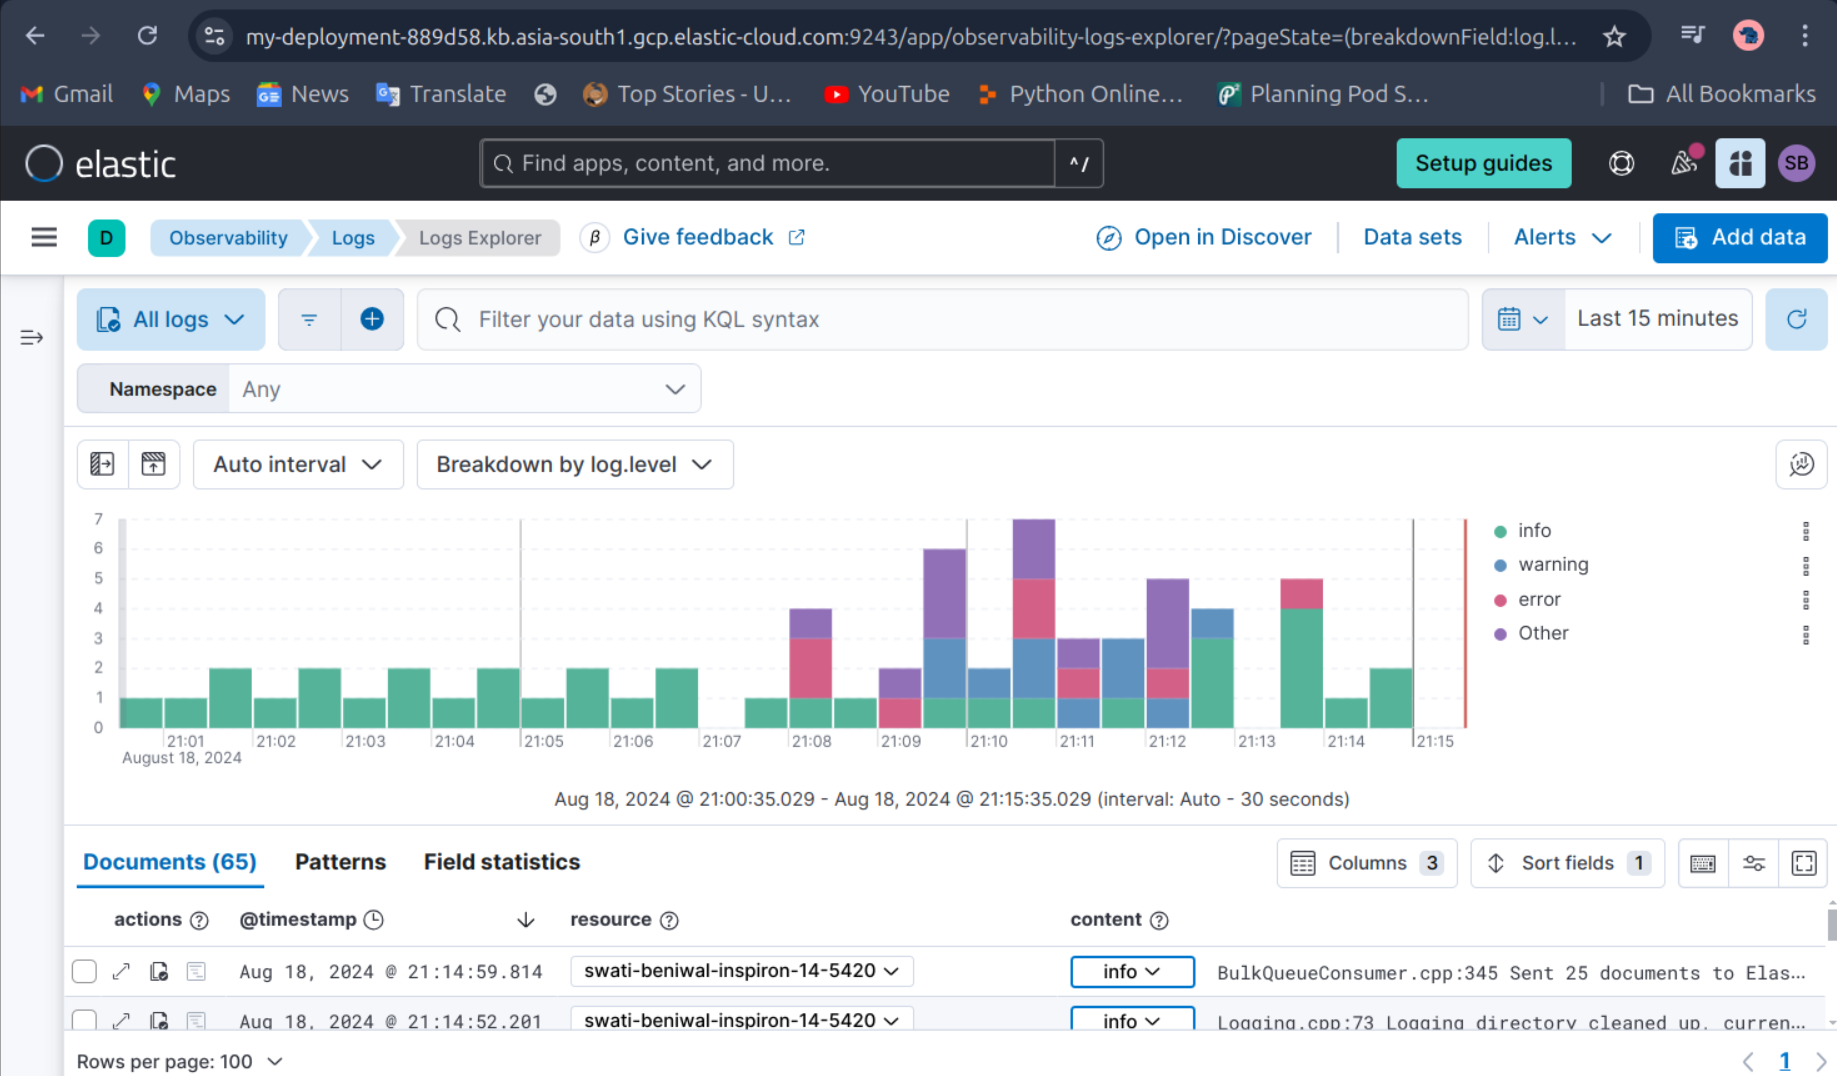
Task 4: Visualize the Events logged
Select “Dashboard” from the menu—-> New Visualization—->select the visualization types—-> In the “Metrics” section of the visualization editor on the right, select “Count” as the vertical field type and “Timestamp” for the horizontal field for your first representation.


The visualizations are all set, run more commands to see the changes and explore all other types and events and familiarize yourself with the environments.